Case study: Kultura Nova Foundation
Background
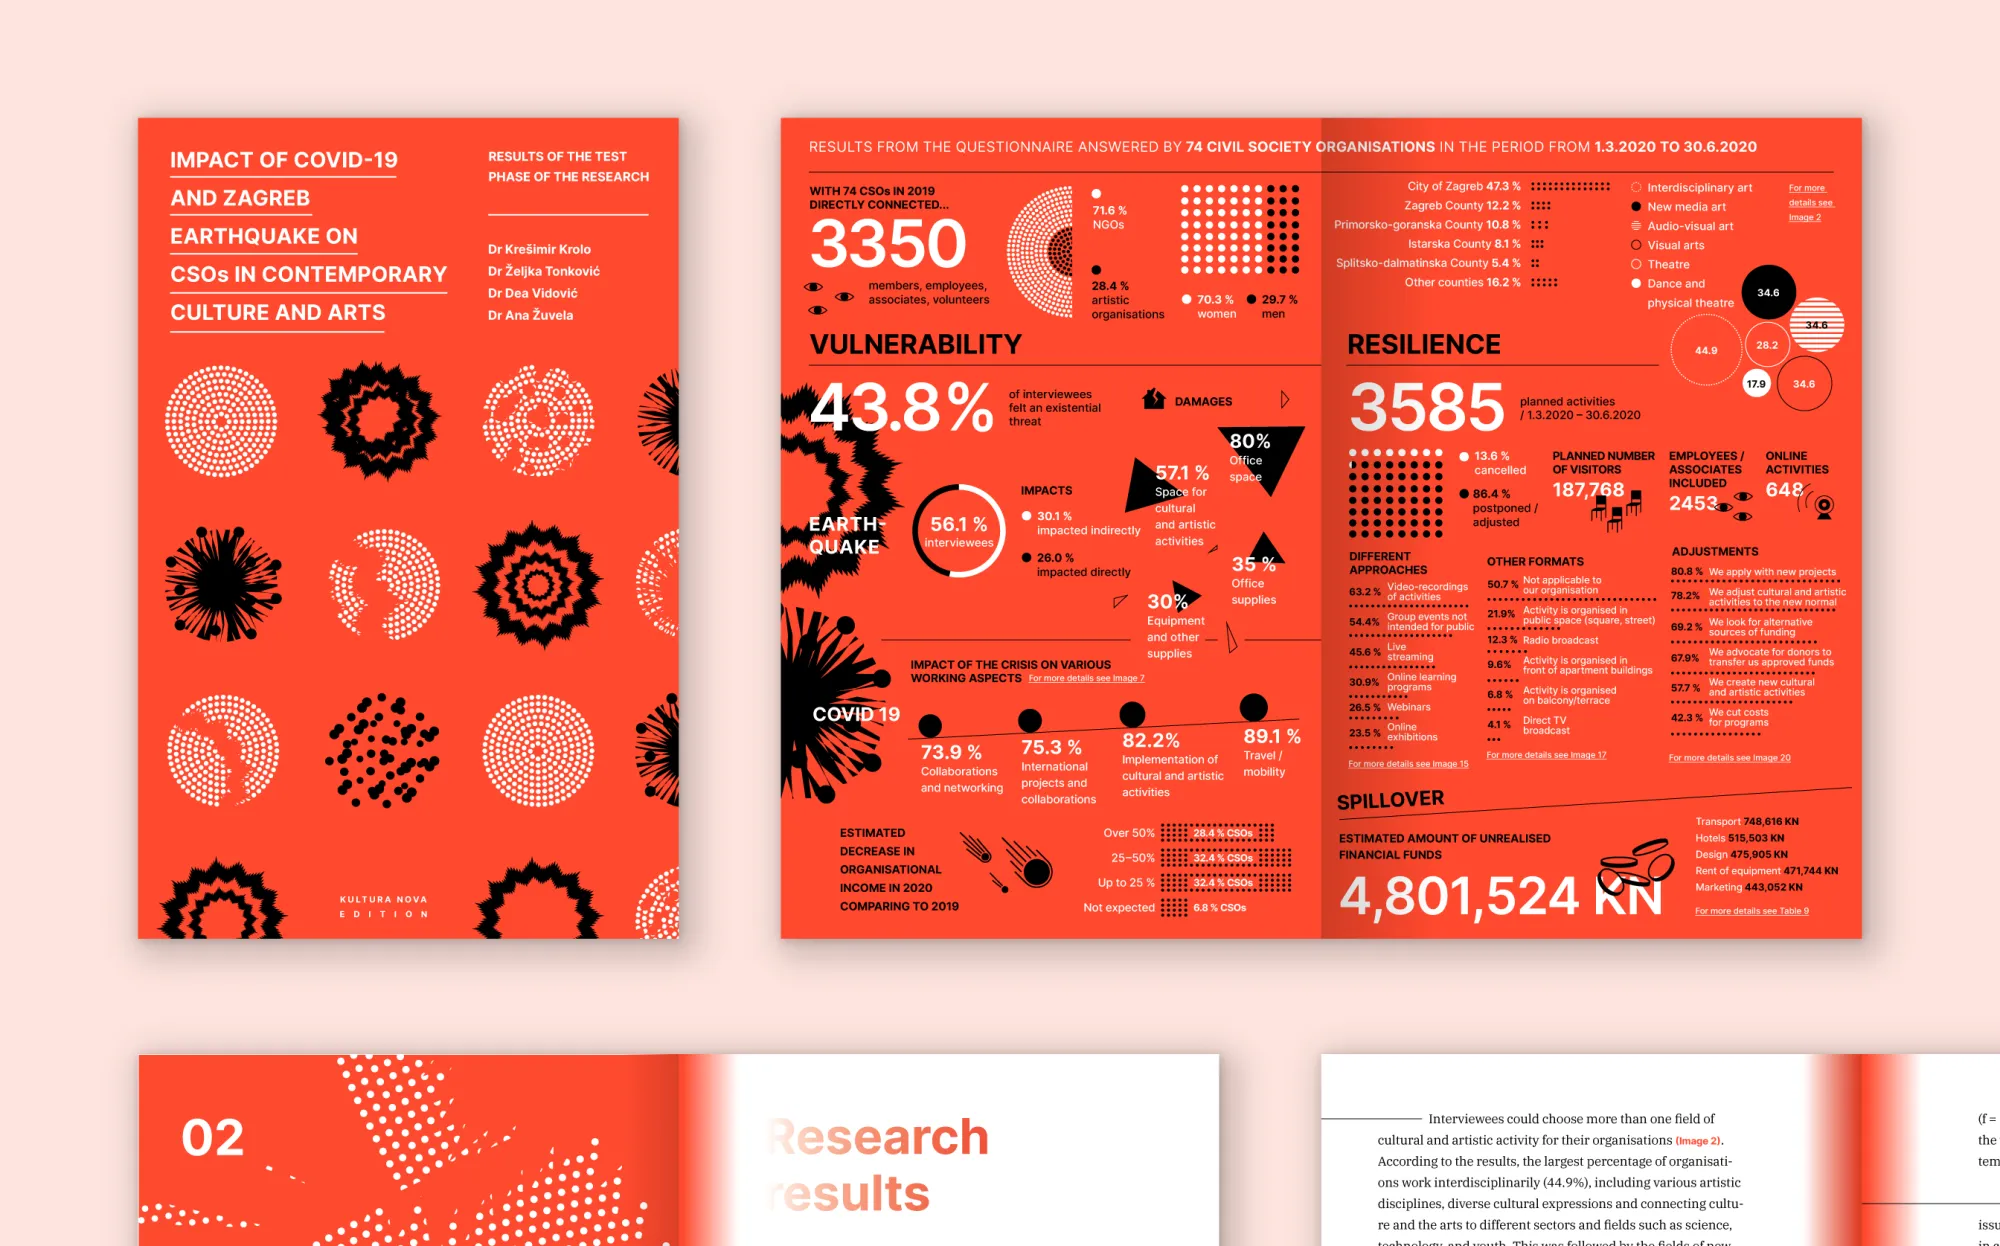
The goal was clear: collect robust, timely data to illuminate the challenges, losses, adaptations, and emerging needs across the cultural field. Once the project got started, it was expanded in collaboration with the Croatian Ministry of Culture and Media to include the broader cultural sector. What emerged from the research was critical but complex: a vast pool of scientific data, detailed, dry, and difficult to digest for anyone outside the research community.
Challenges
While the findings were invaluable for policy-makers and institutions, there was a significant barrier to sharing this insight with a broader audience. The key challenge was how to communicate complex information in an accessible and meaningful way—not just report findings, but ensure they resonated with those most affected: artists, cultural workers, and the general public.
Process
Rather than merely present statistics, the team first distilled human-centered stories from the raw data. This meant identifying patterns, themes, and emotional undertones that revealed the lived experiences behind the numbers.
Next, data specialists, designers, and animators transformed abstract insights into tangible visual forms prioritizing accessibility and engagement, for a digital experience that was both informative and emotionally resonant.
The Foundation launched a promotional campaign to ensure reach beyond the research community. Key communication channels were activated, including social media, digital platforms, and media partnerships, to engage audiences who might otherwise never interact with this type of content.
Central to the promotional strategy were interpretive animated graphics. These data-driven visual tools were designed not just to illustrate findings, but to tell a story. They became the primary instrument for reaching the broader public, helping them interact with and understand the data in a way that was both intuitive and compelling.
Solutions
Interactive animated graphics that invited exploration and helped non-expert audiences interpret findings at their own pace.
A user-friendly digital platform housed the visualizations, ensuring accessibility across devices and user types. A comprehensive visual identity for the data that helped communicate credibility, urgency, and care. The Foundation not only disseminated its findings but built a bridge between research and public discourse.
Impact
The data became visible—not just present, but understood and felt.
Policy-makers could easily reference key data points when shaping recovery measures.
Artists and cultural workers saw their realities reflected and validated in a public forum.
The general public gained insight into how the cultural sector was weathering the crises.
The project set a precedent in Croatia for how data in the cultural sector can and should be communicated. It turned raw numbers into meaningful dialogue, positioning data visualization as an essential tool for advocacy, understanding, and action in times of crisis.